Overview
This article provides a comprehensive guide on utilizing the reporting features within a business intelligence platform, specifically Looker. It covers how to customize reports by changing chart colors and formats, filtering data by specific groups or excluding locked advocates, adjusting date ranges, sorting table data, and drilling down into widgets to access and export underlying data.
Information
The reporting tab (powered by the business intelligence platform, Looker ) allows you to understand the value being generated by your hub, analyze your member behaviour, and understand the activities and social influence of your advocates.
- Changing the date range
- Filtering by groups
- Filtering out Locked Advocates
- Changing the sort order of a widget
- Downloading a Microsoft Excel XLS / Data export
- Drilling in to a widget
- Changing the Chart Formatting / Colouring
Changing the Date Range

You can change the date range for the reports in the current tab as follows:
- Click the side arrow on the Filters section to expand that section
- To select a date range, choose the "is in range" option and then select your start and end dates
- Now click the Run button so that the reports update to reflect your new date range
- You can also select a different type of date range filter, or choose the "matches (advanced)" filter and type in things like "in the last quarter". A full list of possible date filtering is available on this page, scrolling down to the Date & Time section.
Filtering by a Group

- Select the right arrow to expand the Filters section and then on the groups row,
- Choose "is equal to" as your filter type. Start typing the name of the group(s) you are interested in filtering down to.
- Select as many groups as you are interested in including. The report will return all advocates in ANY of the groups you put in. If you would like to remove a group click the "x" icon next to its name.
- Now click the "Run" button, so that the report updates to reflect your selection.
- If you want to add multiple group filtering criteria, click the the + button.
- You can also select different types of group filtering criteria if you are interested.
Note: There is a limitation when you use "does not equal to" filter on 'Groups'. This will result in incorrect data. You will need to create a group in the hub that you are looking for data on using our targeting system and then back in Reporting use the filters to select Group "is equal to" <group that was just created>.
Filtering out Locked Advocates
You can choose not to include locked advocates. Selecting this option provides reporting data on only your currently active advocates, excluding any engagement activity of advocates that have been locked.
Note: By selecting 'No', all historical hub activity of locked advocates is excluded from the report.

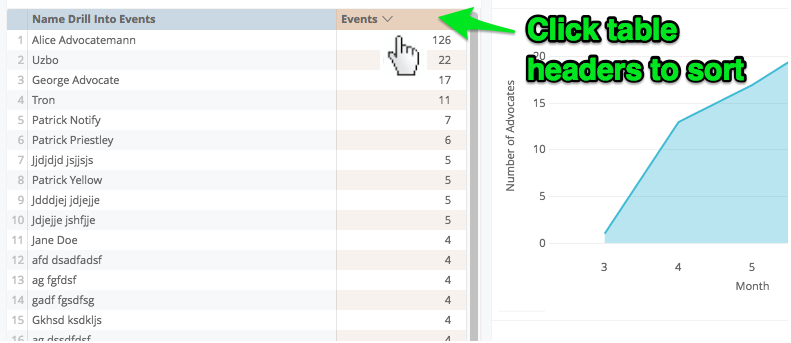
Changing sort order on a table
Downloading an XLS/Data export

- Click the gear icon for the chart you want to download, and then choose the "Download Data" option
- Choose the options you are interested in and then click the download button.
- File Format: The most common options are a CSV or Microsoft Excel Spreadsheet. More advanced options are JSON, HTML, Markdown. and TXT file, which might be useful if you are importing this into another website.
- Values: Formatted values will show you the same values that appear on the screen. Unformatted values will show you the raw numbers, including all available decimal places, and without formatting such as comma separators or $ signs.
- Limit: By default the whole data set for that widget is downloaded, but if you'd like to limit it to a smaller number of rows (say the first 100) you can use this option
- Filename: Specify the filename you'd like this to be called
- Open in Browser: If you'd like to get a preview of the data being exported, you can Open in Browser to quickly see what it looks like. You can also use this to quickly copy and paste a selected set of rows or number.
Drilling in to a Widget
- If a widget is drillable, your cursor will turn into a hand icon like the image below. If the widget shows a number, it will also become underlined.
- Click into the drillable widget, and you will now get access to a Details screen showing the data underneath it. To export this data, click the "Explore from Here" button
- Click the gear in the top right corner, and then click the "Download" button
- Select your download options as in the section above
- To exit the "Explore from Here" view, refresh the page
Changing the Chart Formatting / Colouring
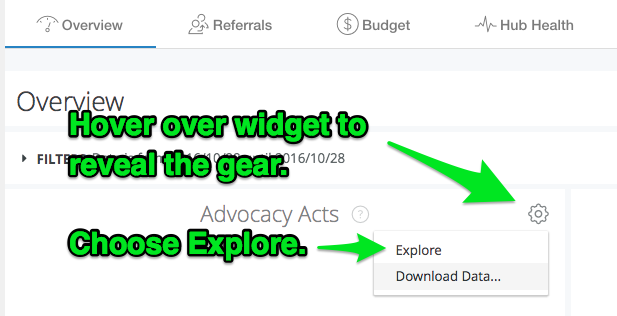
- Click the gear icon next to the widget you'd like to modify, and choose the Explore option
- Use the top chart to change the visualization to the one you'd like
- For a a full explanation of all the visualization options, you can explore this document .
- If you'd like to change the colour scheme, the formatting of the chart, or the axis options click the Edit Gear on the right side of the screen.
- The options for formatting depend on the type of chart. For a full explanation of all options, you can use the side bar on the left side of the help article here.
- Currently there is no way to export this chart as an image file, but you can take a screenshot using your desktop or a browser extension tool like Awesome Screenshot.
FAQ
How can I change the color or formatting of a chart in my report?
You can change the color or formatting of a chart by using the "Explore" option within the reporting tab to customize the visual representation of your data.
Is there a way to filter reports by specific groups?
Yes, you can filter the data to display information for specific groups by using the filter options in the reporting tab, but be aware of the limitation with the "does not equal to" filter for groups and use the targeting system to create accurate group criteria.
Can I exclude locked advocates from my reports?
Yes, you can filter out locked advocates when generating reports to focus solely on the engagement activity of active advocates by selecting the appropriate filter option.
How do I sort data within a table in the reports?
To sort data on a table, click the column header you wish to sort by. Click again to reverse the sort order or click a different column header to sort by that column.
What is the process for downloading data from a report?
To download data, click on the gear icon in the top right corner of the chart, select the "Download" button, and then choose your preferred download options. If you're drilling into a widget, use the "Explore from Here" button to access and export the underlying data.
Priyanka Bhotika
Comments