Overview
This article provides a comprehensive guide to the Overview Dashboard available in the Standard Dashboards tab. It includes detailed explanations of the key metrics, challenge metrics, login metrics, and member activation insights to help users understand and analyze their program's performance effectively.
Information
Please note: This Dashboard has recently been updated! Be sure to re-read this article to understand the new version.

In this article, we will review the Standard Dashboard, what it includes, and how to understand the metrics you will find there. Let's review each row of metrics, one-by-one.
Key Metrics (i.e. the first row of numbers)

Members Joined | All Time: This represents all members who have joined your program to date. This does not respect the date filter and will remain "All Time."
New Joins: The number of members who have joined your program in the given timeframe.
Active Members: An "Active Member" is any member who has had a session log in the given timeframe.
Inactive Members: Inactive Members have not had a session logged in 90 days. If you change the timeframe, you will be looking at members who became inactive during that time.
Average Sessions per Member: Of the Members who logged in to your Program, how many times did they visit during the given timeframe?
Active, Engaged, and Passive Members

Active, Engaged & Passive Members: This is the breakdown of your Active Members. Active members have logged a session, Engaged Members logged a session and took action, while Passive Members logged a session and did not take action. This report will reflect the last three complete months.
Total Engaged & Passive Members: This breaks down what percentage of Active Members were engaged and what percentage were Engaged.
Challenge Metrics

Challenge Completions: The number of Challenges completed by Members each month in the given timeframe.
Challenge Completions per Member: The average number of Challenges completed by each Member.
Login Metrics

Logins per Member: The average number of times each Member has logged in to your Program.
Member Activation
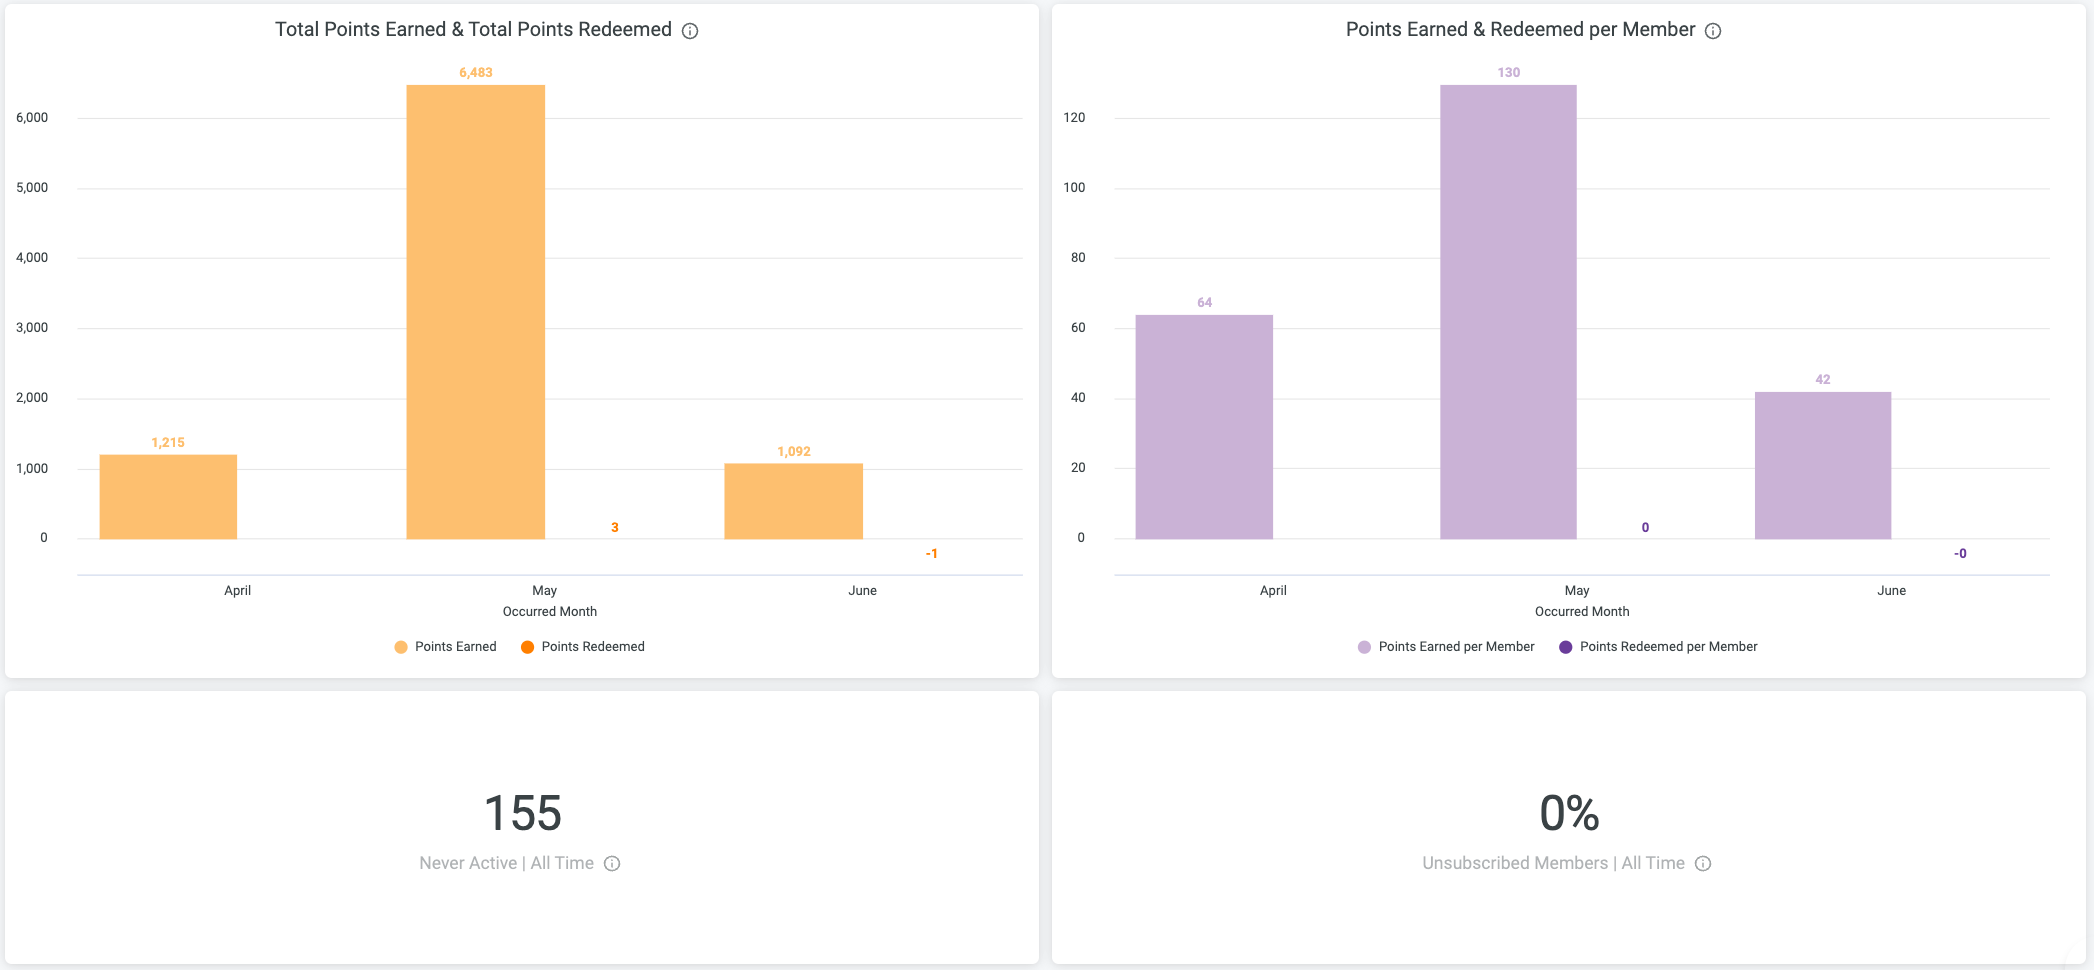
Total Points Earned & Total Points Redeemed: The number of points earned and redeemed by all Members in the timeframe. Points redeemed can exceed points earned because of points previously accumulated outside of the timeframe.
Points Earned & Redeemed per Member: The average number of points earned and redeemed per Member.
Never Active | All Time: The number of Members who created an account but never logged a session beyond the initial setup.
Unsubscribed Members | All Time: Members who have unsubscribed from Program communications. This is cumulative, all time, and does not respect date filters. It is calculated as the number of Members who unsubscribe divided by the total Members who joined.
FAQ
What is the Overview Dashboard?
The Overview Dashboard is a tool available in the Standard Dashboards tab that provides key metrics and insights into member engagement and program performance.
How are 'Active Members' defined?
Active Members are those who have had a session log in the given timeframe.
What does 'Members Joined | All Time' indicate?
It represents the total number of members who have joined your program to date, regardless of the date filter set.
What is the difference between Engaged and Passive Members?
Engaged Members are active members who logged a session and took action, while Passive Members logged a session but did not take any action.
Priyanka Bhotika
Comments